
Point it at a chart.
Get a trading plan.
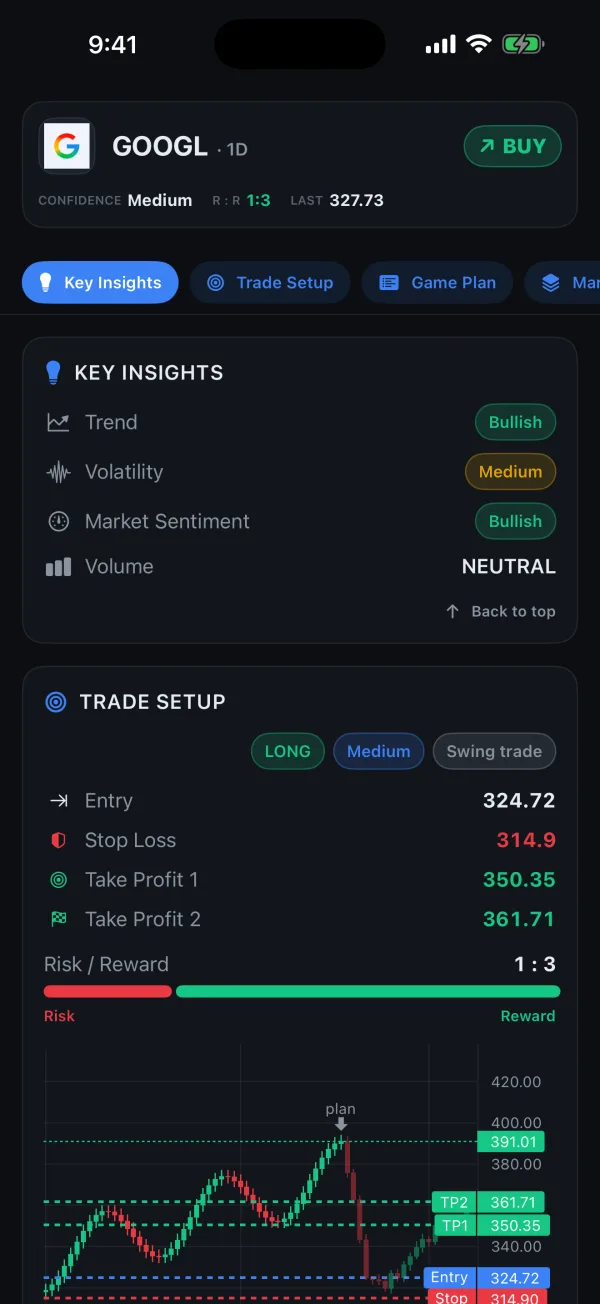
Chart Analysis reads the live chart itself: structure, trend, volatility, volume and market sentiment. What comes back is not commentary — it is a plan with numbers. Entry, stop loss, two take-profit levels and the risk-to-reward they imply, drawn in their real places on the price.


Free to start — 3 AI analyses every day. No brokerage account, no setup.
A full read before a single number
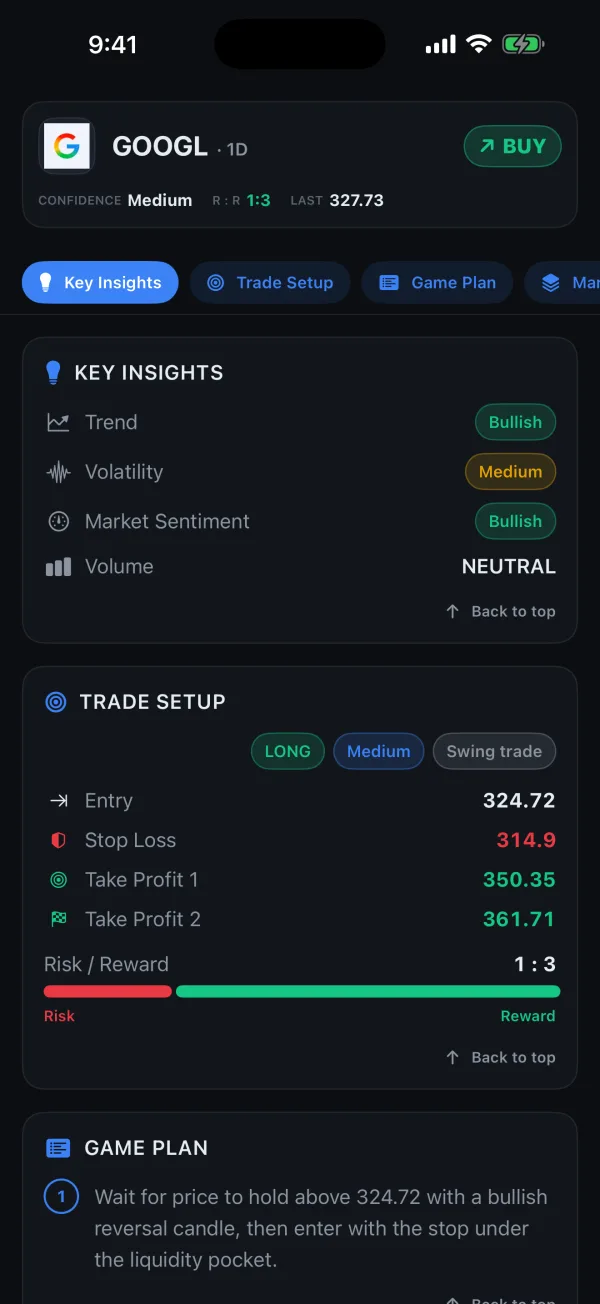
Trend, volatility, market sentiment and volume are each judged and stated plainly, so you can see what the plan is standing on.
Levels, not vibes
Entry, stop and two targets as actual prices, with the risk-to-reward spelled out — the same shape a desk would hand you.
Drawn where it happens
The plan is plotted on the candles, so a level that looks reasonable in text has to look reasonable on the chart too.
The read comes first
Before any level is proposed, the report states what it sees: trend direction, how volatile the tape is, where sentiment sits and whether volume backs the move. If the picture is unclear, it says so instead of inventing a setup.
Your plan, on the price
Entry, stop loss and two take-profit levels appear on the candlestick chart at the prices they refer to — and the game plan below spells out the sequence in words.
Good to know
- Reads the chart of any stock the app covers, on the timeframe you pick.
- Included in the free tier's 3 daily analyses; Chart Analysis is also sold on its own.
- Every plan carries its risk-to-reward and the same not-investment-advice disclaimer.
- Chart reports are saved to history alongside stock reports.
Read your next setup before you take it
Point MyTradAI at the chart and get the trend, the risk and the levels — in one pass, free to start.